Experiment: Average Face of Bachelorette 2019 Contestants
Recently I have seen a new kind of visualization of sorts popping up with increasing regularity, the average face of X. It is not your typical visualization but it brings up many of the same issues that we have to avoid in more traditional visualization like charts and graphs.
He is an example from the BBC where they show the “average face of political power in the US.” Starting with an average face they go on to discuss representation in 2017 in the US. The cool thing about this visual is that it is visceral. You can look at this and initially feel something, but that is exactly why it is important to understand how this kind of visual works.
Why this matters
Understanding how a visualization works is critically important to our ability as readers to interpret the meaning. One great example of this is the bar chart. The first thing to look for when reading a bar chart is if the Y-axis starts or includes 0. If you can’t see 0 on the vertical axis it is difficult to accurately understand what the underlying data is showing you. As a quick example, I have 90, 100. 120, and 180.

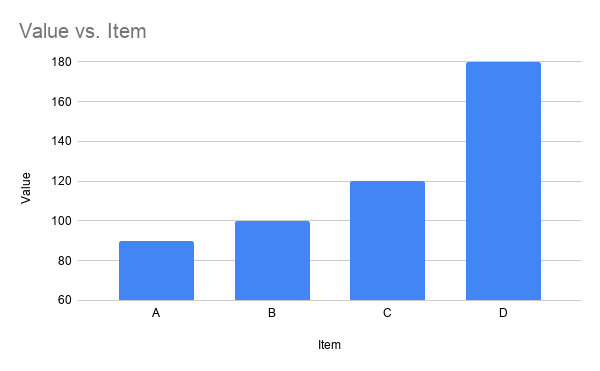
Here in the chart on the left, you can see that A is about half the size of D (as expected when comparing 90 to 180), but in the chart, to the right, it looks like 120 is half of 180. So, looping back to the average face visual, unless we understand how the visual work it would be hard to ensure we are watching for pitfalls and reading the data clearly. One of the best ways for me is to build one myself.
My First Average Face Visual
My wife is a fan of the Bachelor family of TV shows, the show often gets critiqued that all the contestants look the same, and they post headshots of all their contestants. I grabbed all the headshots they posted for the Bachelorette contestants in 2019 and opened up an open-source photo editing program. I followed this tutorial by Ronan Rooney on Medium. You use a few guidelines to align the eyes and mouths of the faces you are trying to merge. Then one by one you add a new headshot, align it, reduce the opacity, and repeat.
From here I started to see some of the issues both in making and interpreting these visuals. First I noticed that not all the photos were taken from the same angle. The structure of this tutorial can work with faces of different sizes because you can resize the images, but the side views will impact the final result. This issue is more pronounced with increased opacity as you can see below. Additionally, as noted in the tutorial, randomly placing the faces in order is important. If you put faces with lighter or darker completions more towards the front can drastically impact the final results. This is critically important since many of the examples of this visual I have seen have been focused on representation and similar issues.
All in all, it took me about an hour at a coffee shop to make the below visuals. What I am showing is one version with every photo at 4% opacity and another at 10% opacity. As you can see 4% makes a more cohesive face but everything is much softer, you get more color (specifically skin tones) with the 10% opacity. This also makes the faces you add later have more of an impact on the final “face” and looks more like a layer of images than a single face.


I decided to leave this in this state, but you could use photo editing tools to make something magazine quality. It wouldn’t surprise me if many of the cleaner “average face" visuals out there are either made with some sort of machine learning that creates a composite image or an artist takes the raw version like above and makes a new, cleaner image. Either way, if you want to make one of these yourself all you need is a handful of headshots and a photo editing program (a link to the one I used is at the bottom of this post).
Takeaways
I think this is a cool visual, but it is important to put more stock in data visualizations than average faces. It is not hard to do, which opens up the opportunity for being done poorly or in a misleading way. At least using the method I used here the later faces (the ones closer to the top) have more of an impact than earlier faces, which is noted in the article I used for the tutorial. On top of this, I want to stress again that our brains are tuned to faces, and often we have an emotional reaction to them for good or bad. This visual is not a chart or graph showing quantitative information, it is sharing a qualitative idea.
I really enjoyed this experiment. Like most visualizations, it is easier to see the potential pitfalls by building and using it yourself. With luck, this high-level discussion will help you be a bit more of a savvy reader as well.
Tool: GNU Image Manipulation Program (open source version of Photoshop)